
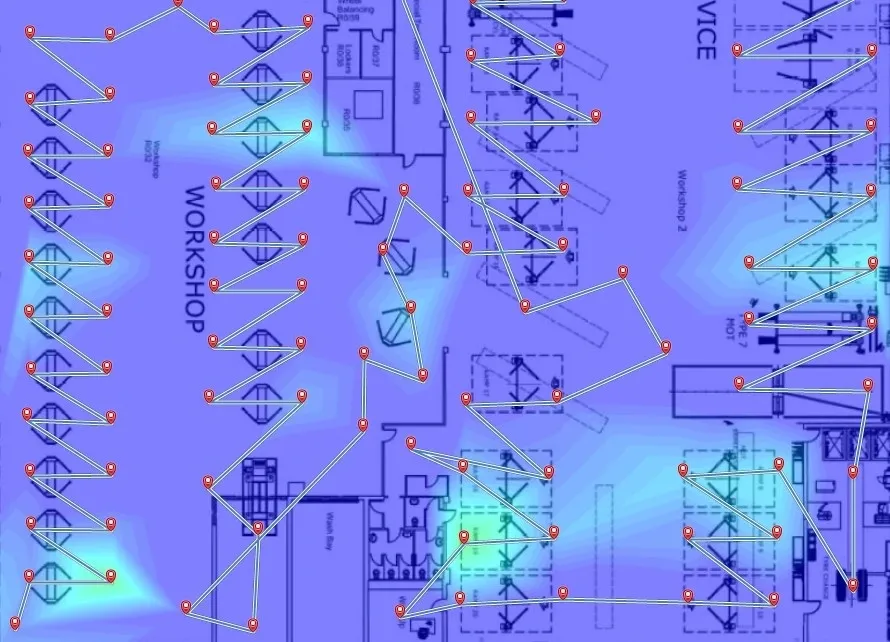
Fig 1: First survey at 5Ghz radio
Spoiler Alert: You can!
Plotting where to put your Wireless Access Points (APs) can be a fairly inexact science, building materials, objects, people and interference can all play a big part in how radio waves are transmitted around a building. There are some software packages that can predict how these signals might behave, which can be used to perform a predictive survey, but the real proof is seeing how they behave once they are live.
We’ve been carrying out a lot of WiFi surveys recently, and the results have been very interesting. This blog will show you what we saw..
In addition to placement of APs there are a number of other factors to be taken into account. Read our other blog on WiFi Antenna Orientation and Signal to find out more about this.
First Survey
Our customer, a car dealership, uses WiFi to perform software updates on their vehicles. After a recent upgrade of the Access Points the users were complaining of slow connectivity when performing the updates to the vehicles. The devices they use are operating in the less crowded 5Ghz frequency range, which also gives higher speeds. Our first survey showed a very poor signal across the entire workshop area (fig 1).
We worked closely with their IT department to determine what the issues might be. There were more than enough APs in the area to cover it in it’s entirety, and the Cisco equipment they are using is certainly capable!
We began a process of changing certain variables and measuring the differences to see what impact it had on coverage. We looked into the background noise levels to see if they were being affected. We dropped all the cars down from the ramps to see if they were having an effect on the signal propagation around the building.
The Result
We found a number of issues, predominantly with the configuration of the access points. The workshop area APs were mounted at high level, well within the tolerance of the manufacturer, but still quite high up above the car ramps.
Cisco access points have lots of clever functionality, one of these being an automatic adjustment of the WiFi signal power output. With the access points being up high and in clear space they could see each other (in terms of radio signals) quite clearly. This caused them to adjust their power levels down, in some cases to just a fraction of their capability at around 12.5%. The channels weren’t overlapping, so the decision was made to increase the power manually to 100%.
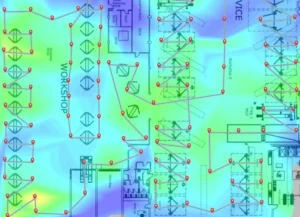
The resulting survey (fig 2) clearly shows a marked improvement over the received signal at ground level, despite being surrounded by cars on ramps, vans, parts and equipment. The survey results have given the customers IT team a clear indication of what needs to happen across their dealerships to alleviate the issues their users were facing.
What use is a survey to me?
You get peace of mind from knowing how your WiFi signal is being distributed around your buildings. Users like to complain, particularly about WiFi and internet speeds. By mapping out your WiFi signals you can easily see if the issue is a genuine coverage issue, or some other factor that can be addressed another way. Don’t waste money by installing and cabling new access points to cover an area that might not need it.
Litenet will work with your IT department closely to identify and resolve WiFi issues. Our surveying software can select specific SSIDs, individual access points, 2,4Ghz, 5Ghz or both frequency ranges. We present all of our findings to you for your reference and can even carry out the remediation works for you. Moving access points, cabling to new ones, fitting external antennas, you name it. We have IPAF certified engineers who can use scissor lifts or cherry pickers for high level mounting.
Get in touch with us to book your WiFi survey! Email info@litenetuk.com or call us on 01908 794 794